Overview #
Modern smartphones house a variety of motion and environmental sensors beyond the main microphone. Some of these non-microphone sensors can unintentionally capture acoustic vibrations as a side channel, enabling attackers to infer spoken words, keystrokes, or ambient activities.
In this mini-project, I investigate whether, how, and how effectively a smartphone’s built-in MEMS accelerometer can capture sound waves, reproduce acoustic patterns, and leak private information—concluding with a discussion on security and privacy mitigations.
Selected Experimental Scenarios #
- Physical Surface Vibrations: Knocking on a table while the smartphone rests on the same surface.
- Airborne Acoustic Signals: Playing music from an external loudspeaker positioned near the smartphone.
1. Executive Summary #
This study evaluates the feasibility, accuracy, and repeatability of recovering acoustic information from MEMS accelerometer sensor data in real-life scenarios.
Key Findings:
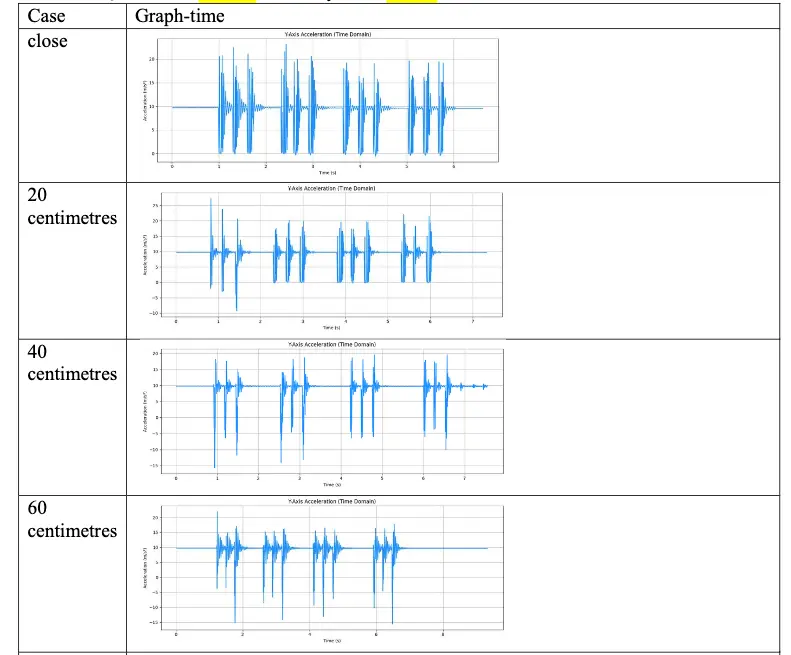
- Range & Quality: MEMS accelerometers can reliably capture simple impulse vibrations (e.g., table knocks) up to 60 cm. However, complex acoustic signals (such as speech or multi-frequency music) cannot be fully reconstructed due to severe high-frequency signal loss.
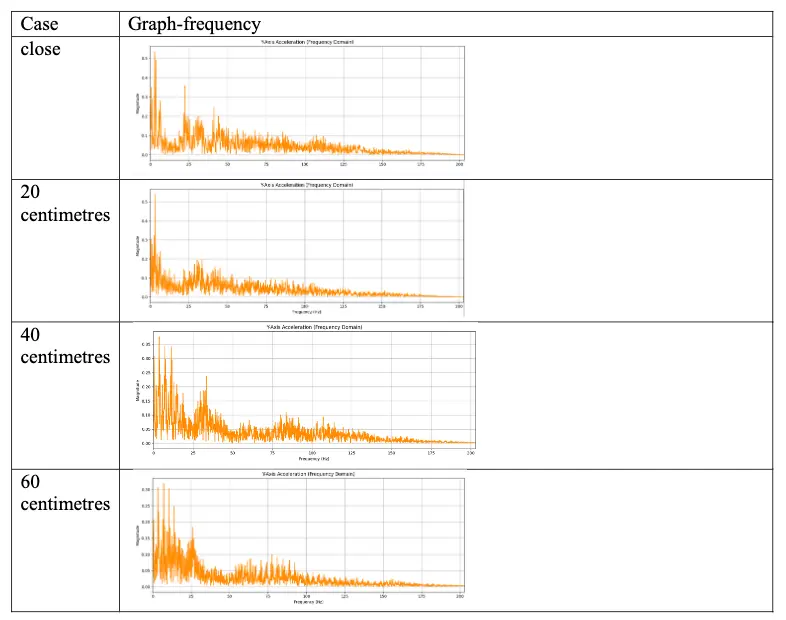
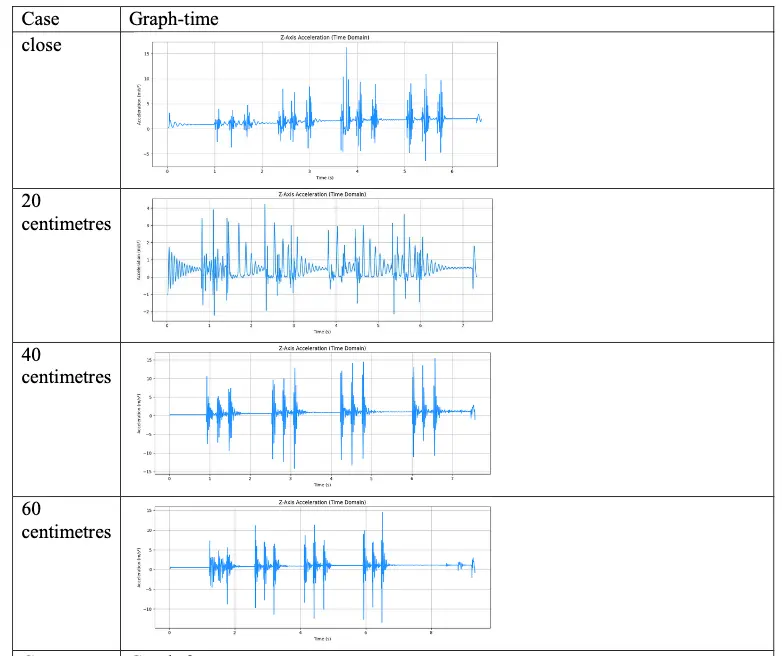
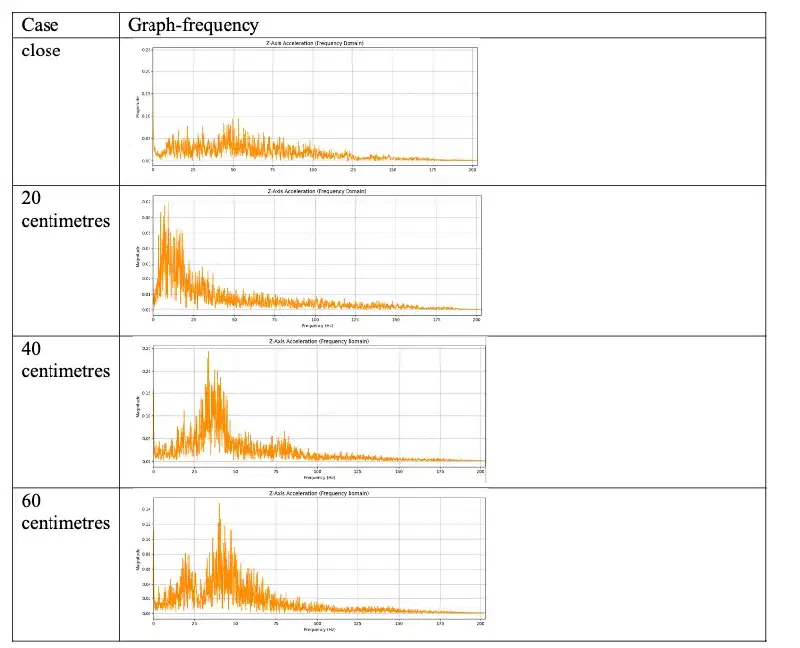
- Axis Sensitivity: Axis orientation plays a crucial role. The X-axis captures negligible vibrational power across most setups, whereas a vertically placed phone using the Y-axis and a horizontally placed phone using the Z-axis consistently yield the highest signal recovery accuracy.
2. Background and Related Work #
Prior literature has extensively surveyed acoustic side-channel attack vectors, vulnerable devices, and mitigation strategies [1]. Unintentional sound emanations can reveal sensitive physical actions—such as keystrokes on a mechanical keyboard or active app usage—and are often mitigated by physical isolation or distance constraints.
While early acoustic attacks focused on smart home ecosystems [2], mobile platforms present unique exposure risks:
- Users frequently reject microphone permission requests for untrusted mobile apps.
- However, motion sensors like MEMS accelerometers are typically treated as zero-permission or low-risk APIs, allowing malicious apps to quietly capture ambient physical vibrations in the background without explicit user authorization.
3. Accelerometer and Mechanisms #
Physical Mechanism #
Modern smartphones utilize Micro-Electro-Mechanical Systems (MEMS) accelerometers. Inside, a tiny proof mass is suspended by microscopic silicon springs connected to the sensor frame. Physical movements generate mechanical stress on these springs along the X, Y, and Z axes, which is converted into digital acceleration measurements.
Because acoustic waves are fundamentally physical vibrations, high-volume air or surface waves physically couple with these microscopic springs—acting as an inadvertent, low-fidelity microphone.
Calculating Real Sampling Rate #
To determine the maximum recoverable frequency (Nyquist limit), we calculate the actual sensor sampling rate from captured timestamped logs:
- Total Samples Captured: 2377 − 1 = 2376 samples
- Start Time: 0.0173 s
- End Time: 5.8600 s
- Total Time Elapsed: 5.8600 − 0.0173 = 5.8427 seconds
Sample Rate = 2376 samples / 5.8427 s ≈ 406.66 Hz
The average effective sampling rate of the smartphone accelerometer in this experiment is ~406.5 Hz. According to the Nyquist-Shannon sampling theorem: the frequency equal to half of the sampling rate, the maximum theoretical frequency we can capture is only ~203 Hz, explaining why high-frequency voice or audio details are filtered out.
4. Scenarios & Experimental Design #
Scenario A: Knocking on the Table #
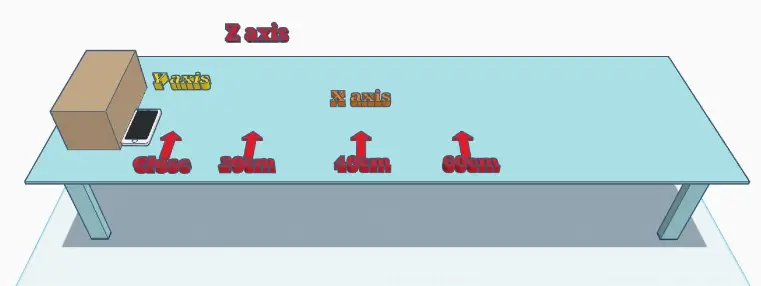
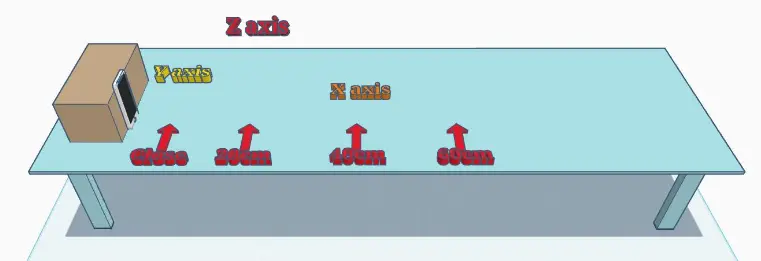
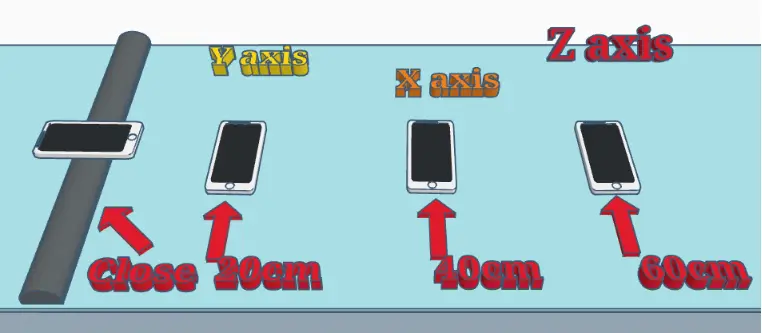
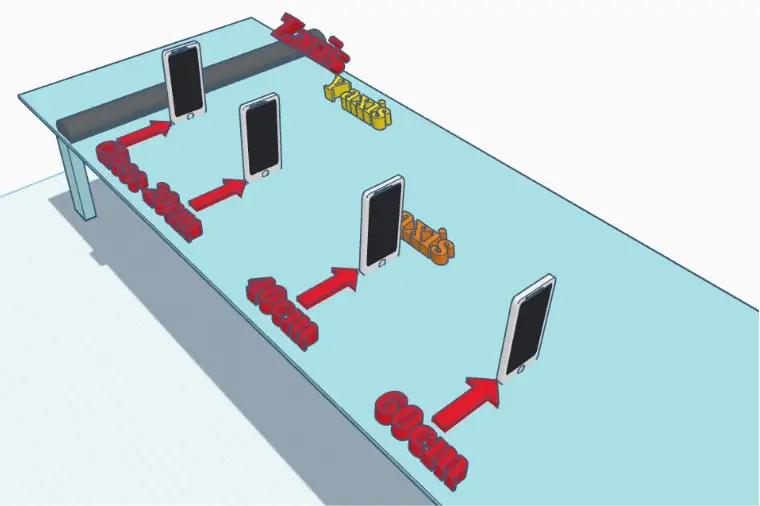
- Distances Tested: Close (~5 cm), 20 cm, 40 cm, and 60 cm.
- Phone Orientations:
- Horizontal Placement
- Vertical Placement
- Horizontal Placement
Note: The red labeled region indicates the designated knocking zone. The phone remains stationary while physical impacts are applied to the surface.
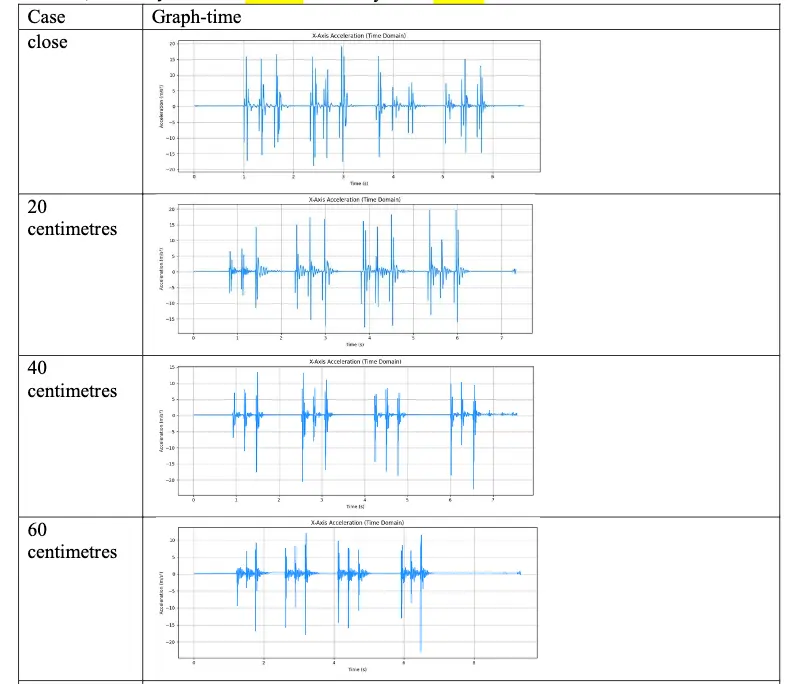
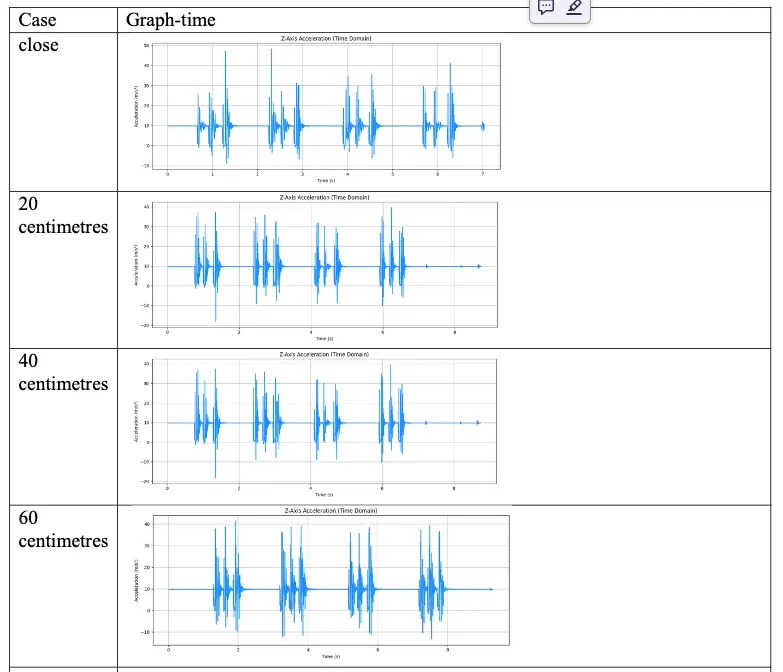
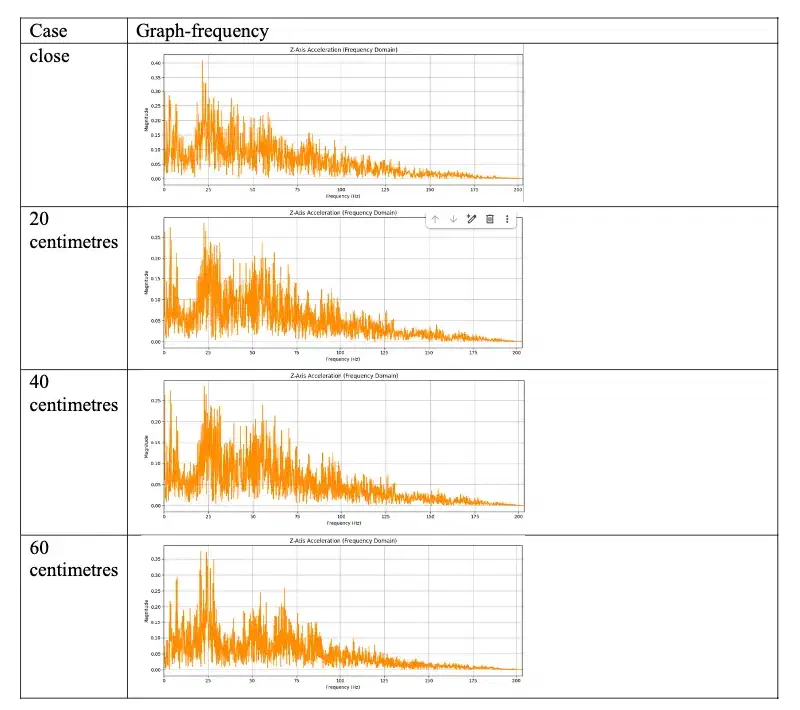
- Pattern Executed: Three consecutive knocks on the marked location, followed by a brief pause, repeated over 4 cycles.
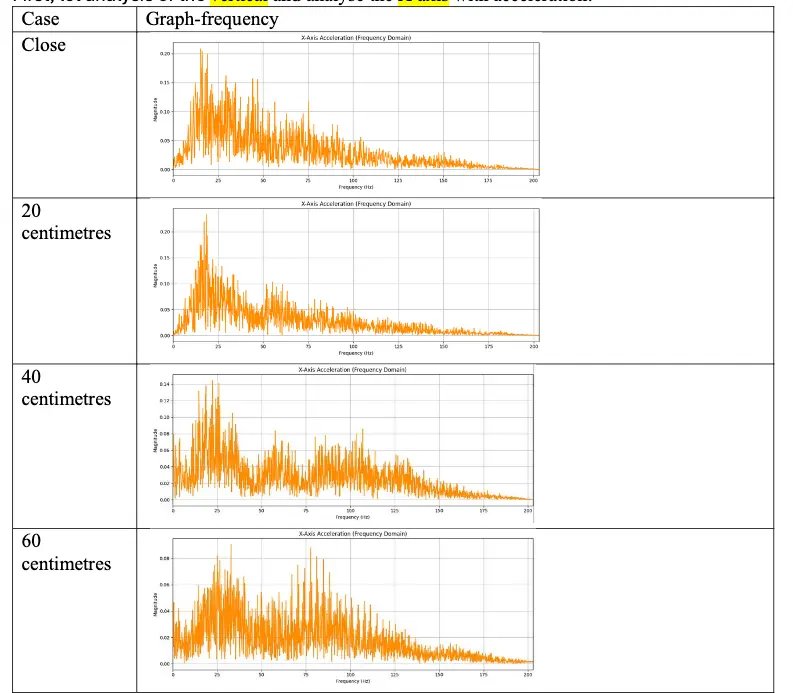
1. Vertical Orientation Analysis #
-
X-Axis Acceleration (Time & Frequency):
-
Y-Axis Acceleration (Time & Frequency):
-
Z-Axis Acceleration (Time & Frequency):
2. Horizontal Orientation Analysis #
-
X-Axis Acceleration:
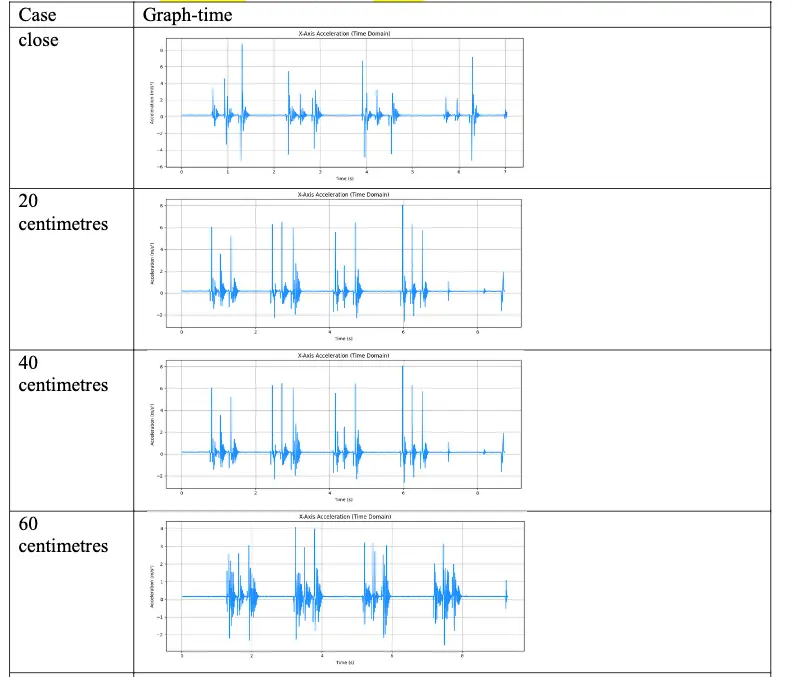
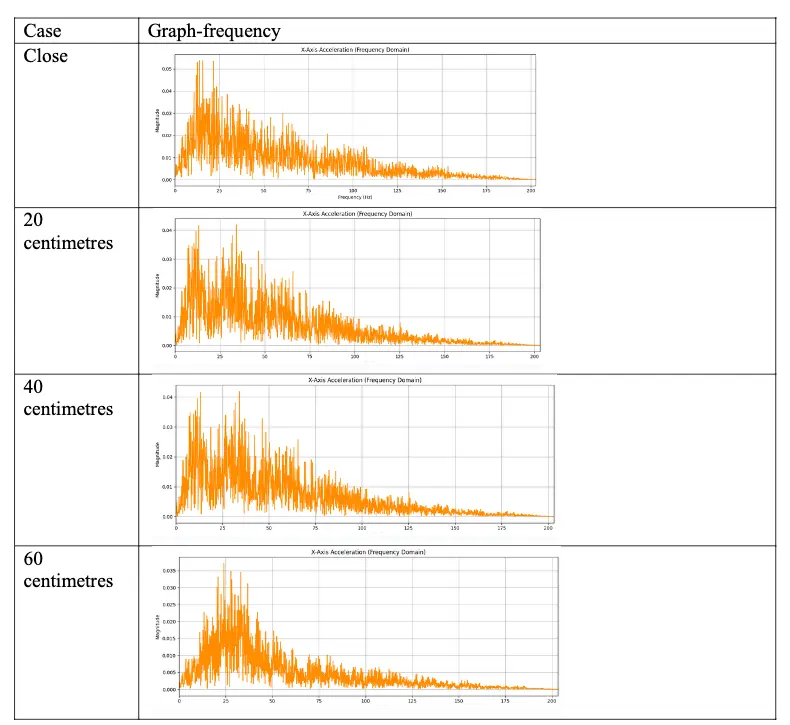
-
Y-Axis Acceleration:
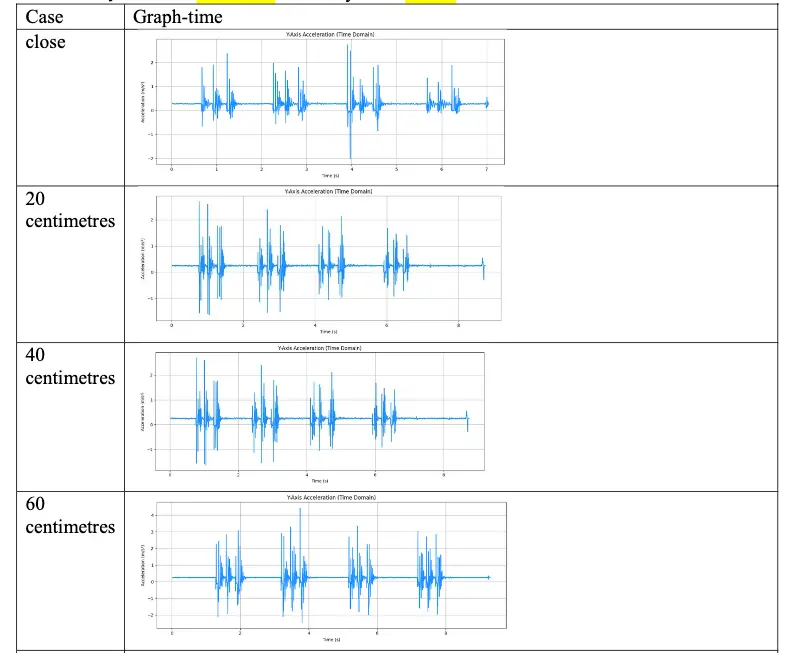
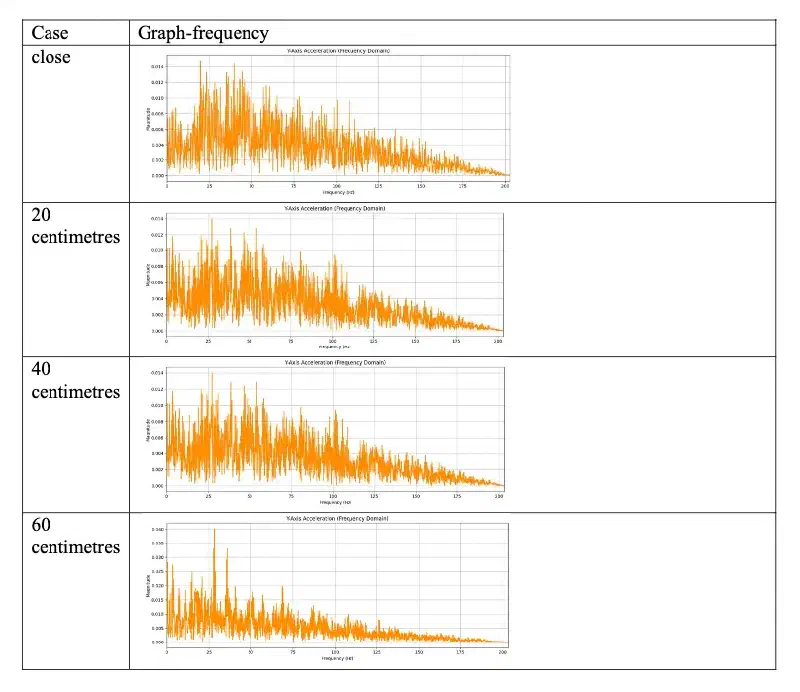
-
Z-Axis Acceleration:
Scenario B: Music Playback from External Speaker #
-
Distances Tested: Close (~5 cm), 20 cm, 40 cm, and 60 cm.
-
Phone Orientations:
- Horizontal
- Vertical
- Horizontal
-
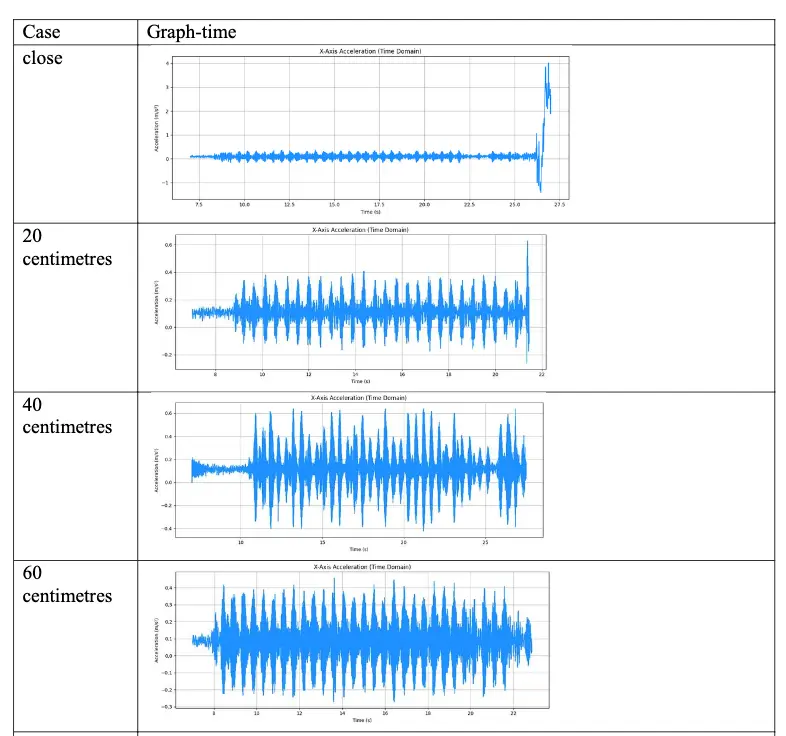
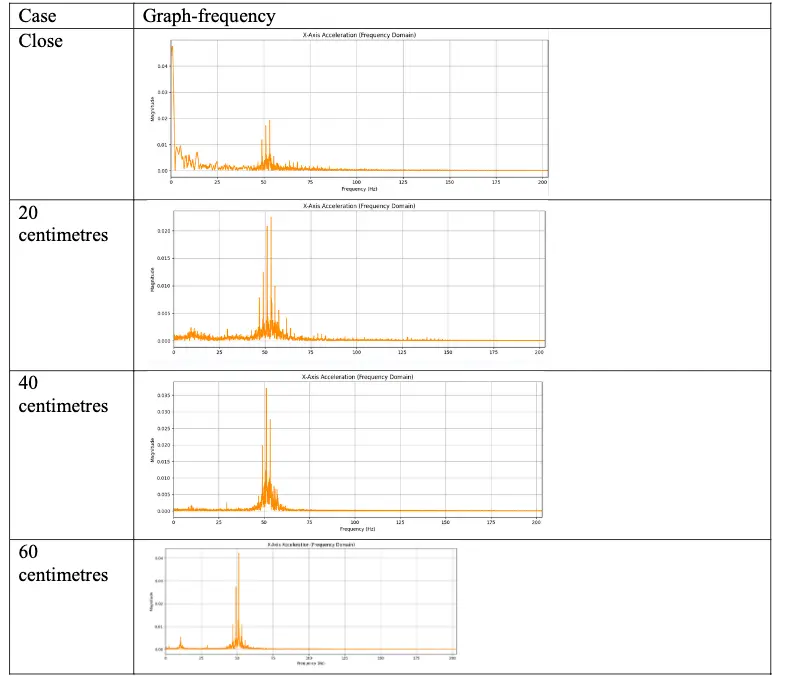
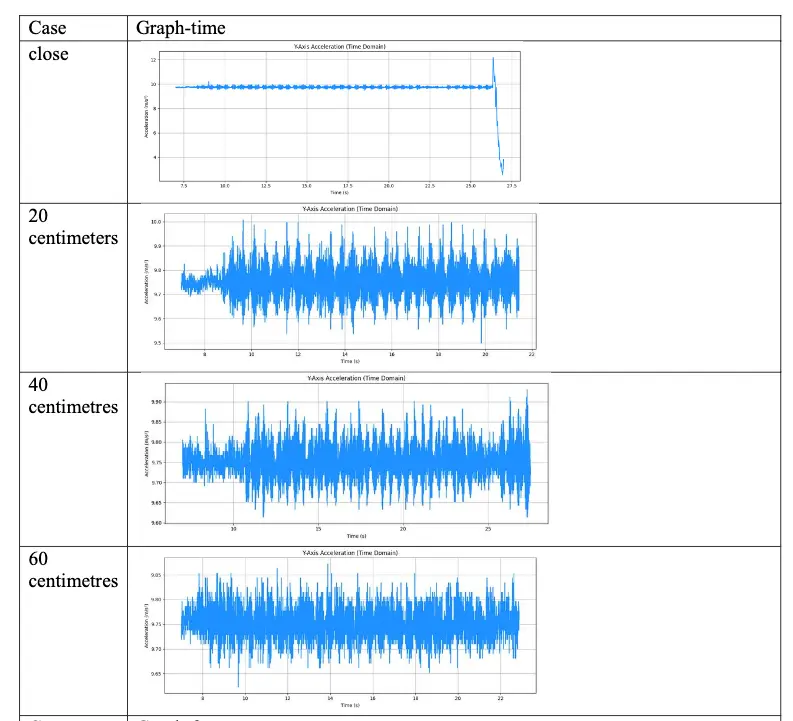
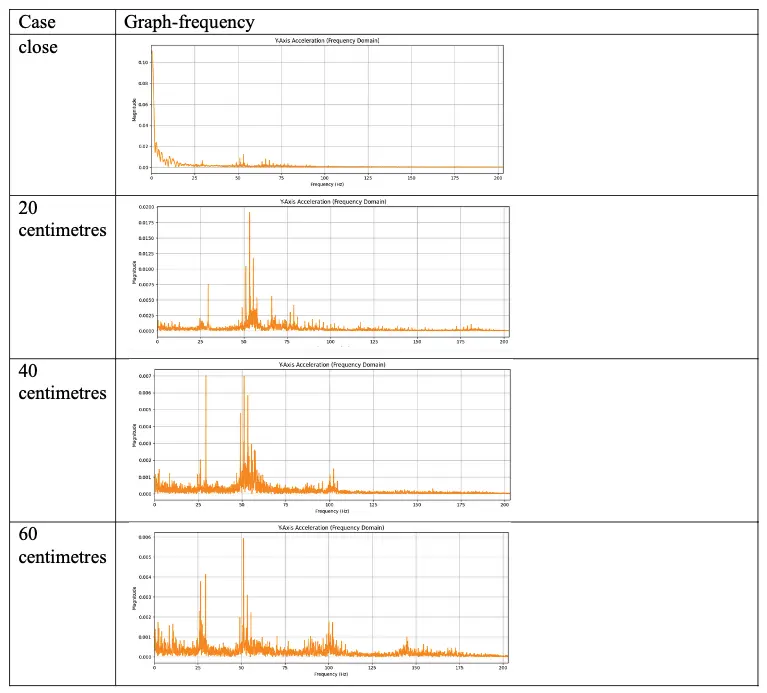
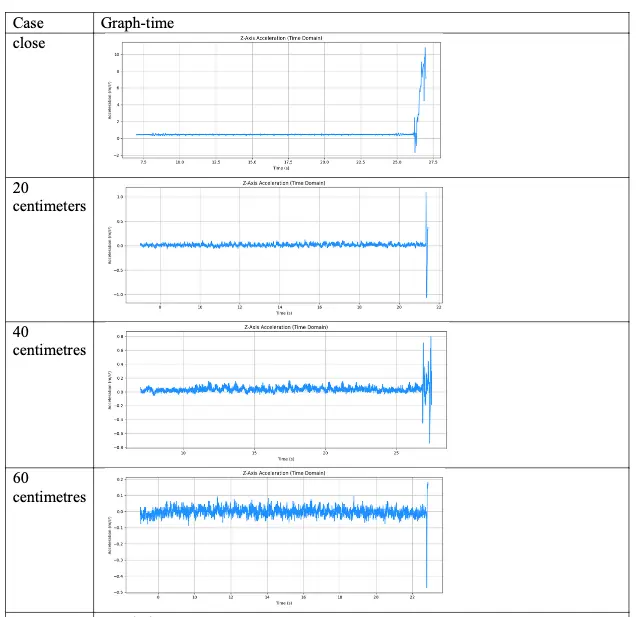
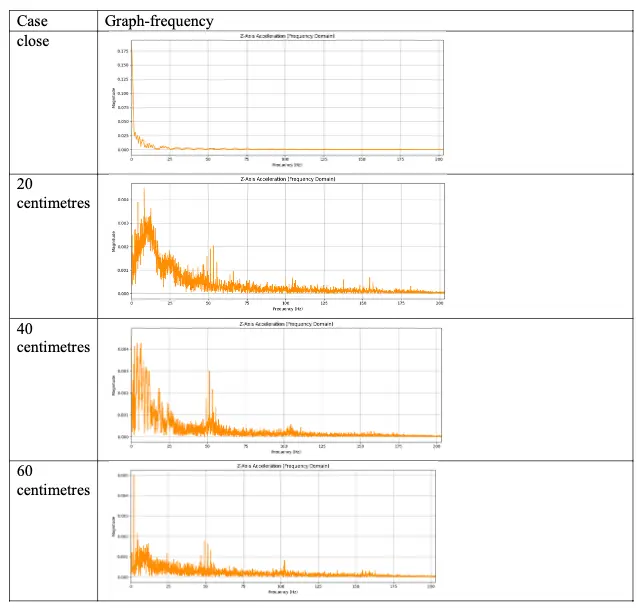
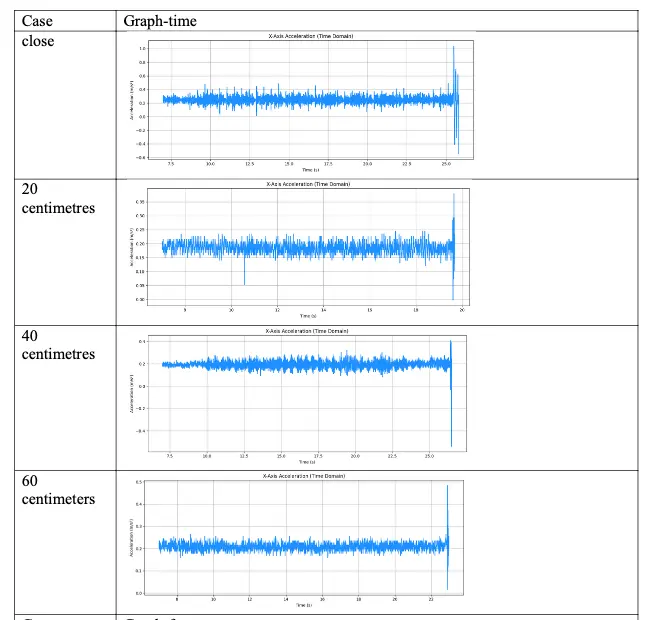
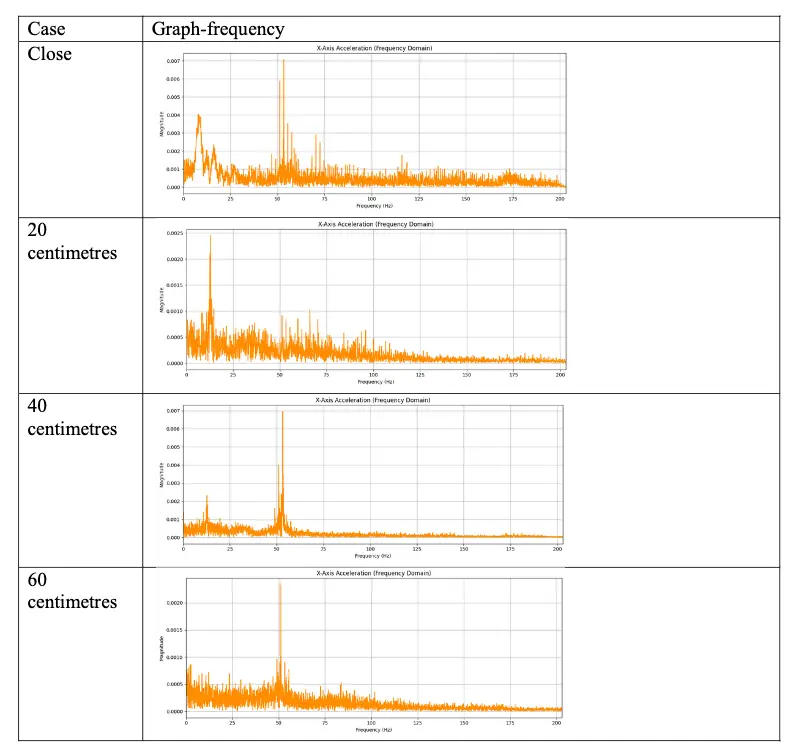
Audio Source: Loudspeaker playing Teriyaki Boyz - Tokyo Drift [Bass Boosted] (playback timestamp 0:56 to 1:16).
1. Vertical Orientation Analysis #
-
X-Axis:
-
Y-Axis:
-
Z-Axis:
2. Horizontal Orientation Analysis #
-
X-Axis:
-
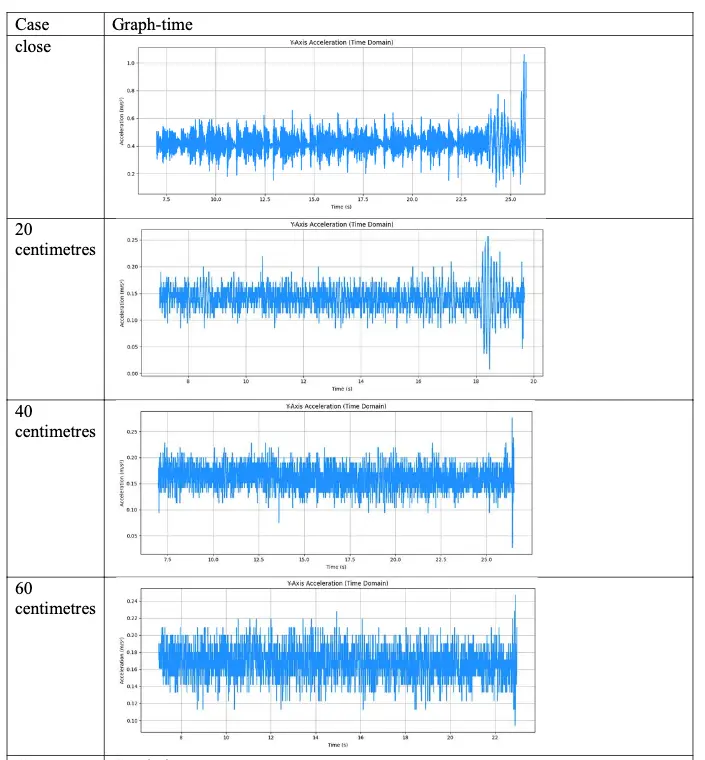
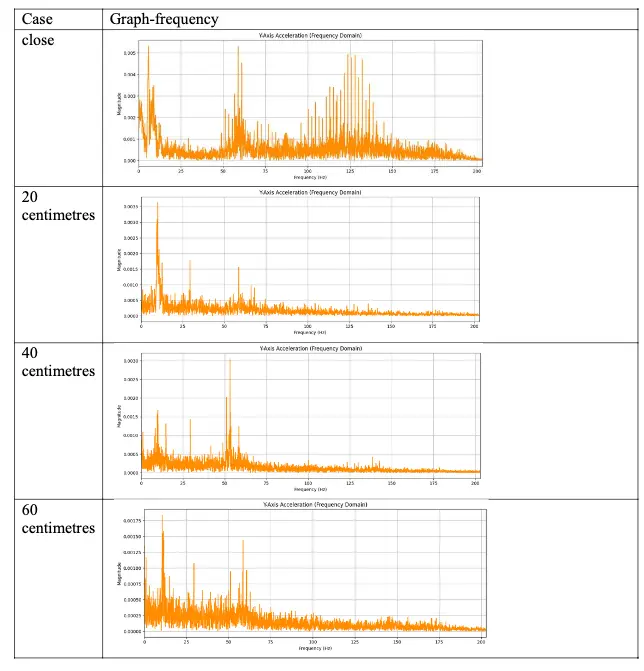
Y-Axis:
-
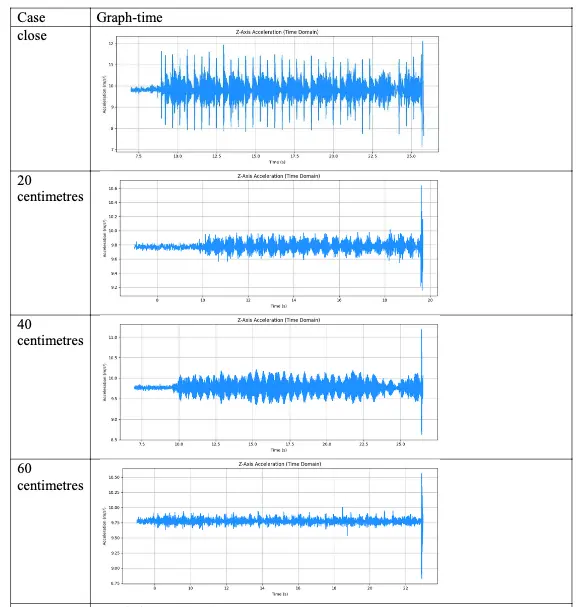
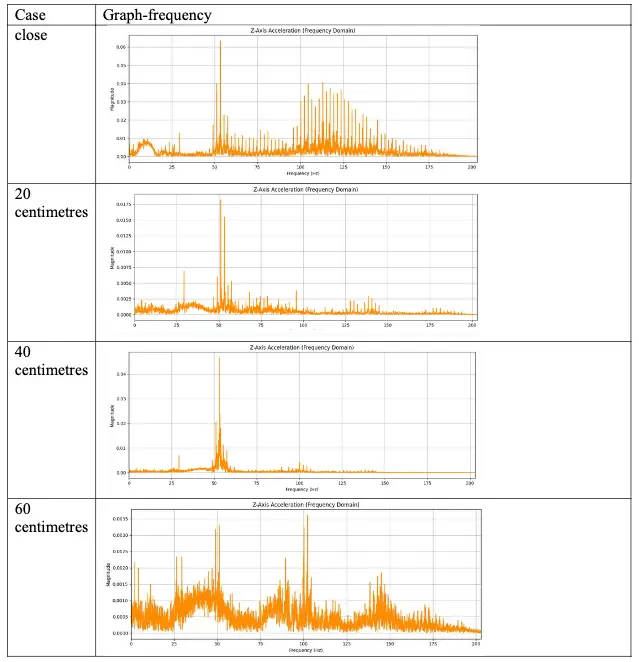
Z-Axis:
5.Reconstruction and Analysis #
1. Scenario A Summary (Table Knocking) #
Distinct temporal knock patterns remained recognizable across all tested distances. However, increased distance significantly degraded signal amplitude:
- At 60 cm, rhythmic timing is still visible, but finer impact intensity variations are lost.
- Because frequencies above ~203 Hz (half of our 406.5 Hz sampling rate) are cut off, soft versus hard impacts become difficult to distinguish at longer range.
2. Scenario B Summary (Music Playback) #
The overall quality of audio pattern recovery varied across distance and axis combinations:
| Distance | Optimum Orientation & Axis Combination |
|---|---|
| Close (~5 cm) | Horizontal Position + Z-Axis |
| 20 cm | Vertical Position + Y-Axis |
| 40 cm | Vertical Position + Y-Axis |
| 60 cm | Horizontal Position + Z-Axis |
Key Takeaways: #
- Axis Performance: The Y-axis (in vertical orientation) and Z-axis (in horizontal orientation) captured physical vibrations far better than the X-axis, which recorded negligible energy.
- Frequency Dependence: Tracks dominated by high-frequency guitar or vocal lines (e.g., classical guitar) fail to reconstruct entirely. Conversely, bass-heavy tracks (Tokyo Drift) transfer strong low-frequency kinetic energy, preserving the core rhythm in signal recovery.
Reconstruction Audio Sample #
6. Security Implications and Countermeasures #
Threat Landscape #
Even without full speech-to-text recovery, malicious actors can exploit low-frequency vibration signatures to infer sensitive actions, such as:
- Keystroke Timing & Password Length: Mechanical typing generates distinct low-frequency impulses. Capturing stroke counts and inter-keystroke delays significantly narrows password brute-force search spaces.
- Bypassing App Permissions: Because sensor APIs like accelerometers are often unmonitored by permission managers, malicious background apps can collect physical data without triggering user alerts.
Proposed Mitigations #
-
OS Background Limits: Operating systems should strictly throttle sensor sampling rates when apps run in the background [3].
-
Intent-Based High-Level APIs: Instead of exposing raw high-frequency sensor readings, operating systems can provide abstract boolean event hooks (e.g.,
onDeviceRotated()):// Safer abstract API implementation example boolean isUserRotated = false; if (detectOrientationChange()) { isUserRotated = true; } return isUserRotated; // Hides raw MEMS waveform from the application
That can prevent attacker to passive obtain actual EMES accelerometer data.
7.Limitations, Conclusion, and Future work. #
Limitations
Hardware Hardware Differences: Sampling rates vary across platforms (e.g., iOS devices often enforce lower background sensor limits than Android).
High-Frequency Attenuation: Standard consumer mobile sensors lack the bandwidth to record human speech intelligibly without specialized neural reconstruction.
Conclusion
Acoustic side-channel inference via MEMS accelerometers is feasible, but highly dependent on physical coupling and distance. While Scenario A proved that physical impacts (table knocking) are easily detectable at 60 cm, Scenario B confirmed that airborne acoustic waves require high bass energy and optimal phone orientation to recover rhythm patterns.
Future Work
Future research could explore multi-sensor fusion (combining accelerometer, gyroscope, and ambient light sensors) alongside Graph Neural Network (GNN) architectures [4] or spectrogram-based classifiers [7] to reconstruct acoustic data and mitigate noise. In cryptographic contexts, side-channel attacks have been shown to extract full 4096-bit RSA keys using acoustic leakage [6], underscoring the importance of robust hardware shielding and secure API design [5].
References #
[1] S. Venkateswarlu, “An Overview of Acoustic Side-Channel Attack,” Academia.edu, 2013. https://www.academia.edu/91617557/…
[2] “Side channel attacks on smart home systems: A short overview,” IEEE Xplore. https://ieeexplore.ieee.org/document/8217429
[3] “Background Execution Limits,” Android Developers, Mar. 28, 2025. https://developer.android.com/…
[4] S. Abbas et al., “Securing Data from Side-Channel Attacks: A Graph Neural Network-based Approach for Smartphone-based Side Channel Attack Detection,” IEEE Access, pp. 1–1, Jan. 2024. https://doi.org/10.1109/access.2024.3465662
[5] R. K. M. K. Yalla et al., “An effective security-aware side channel attack detection framework using RA-GRU and TPCC,” Australian Journal of Electrical and Electronics Engineering, pp. 1–15, Mar. 2025. https://doi.org/10.1080/1448837x.2025.2470571
[6] D. Genkin, A. Shamir, and E. Tromer, “Acoustic Cryptanalysis,” Journal of Cryptology, vol. 30, no. 2, pp. 392–443, Feb. 2016. https://doi.org/10.1007/s00145-015-9224-2
[7] Z. Martinasek, V. Clupek, and K. Trasy, “Acoustic attack on keyboard using spectrogram and neural network,” Jul. 2015. https://doi.org/10.1109/tsp.2015.7296341